%2016-05-2016.jpg)
Palestine
Map

The first map (1946), approximately a year before Israel was created, shows that Jewish communities owned no more than 6% of historic Palestine and represented 30% of the population.
The second map spells out the United Nations partition plan of 1947, which awarded the Jewish community a state on 55% of the land alongside a much reduced Palestine even though Palestinians were the strong majority of the land’s inhabitants.
The third map (1948-1967) displays the armistice lines from the 1948 Arab-Israeli war. In this map Israel controls 78% of the land.
The fourth map is where we are today. In the 1967 war, Israel took control of the West Bank and the Gaza Strip. The Israeli occupation – now in its 45th year - of the West Bank is being made permanent as Israel systematically takes more and more Palestinian land to accommodate Israel’s massive settlement project to establish irreversible “facts on the ground”. Over half a million Israeli settlers now live in the occupied West Bank. Under international law, it is illegal for Israel to move Israeli settlers into the occupied Palestinian territories. Israel is on the verge of annexing 60% of the West Bank.
Flag
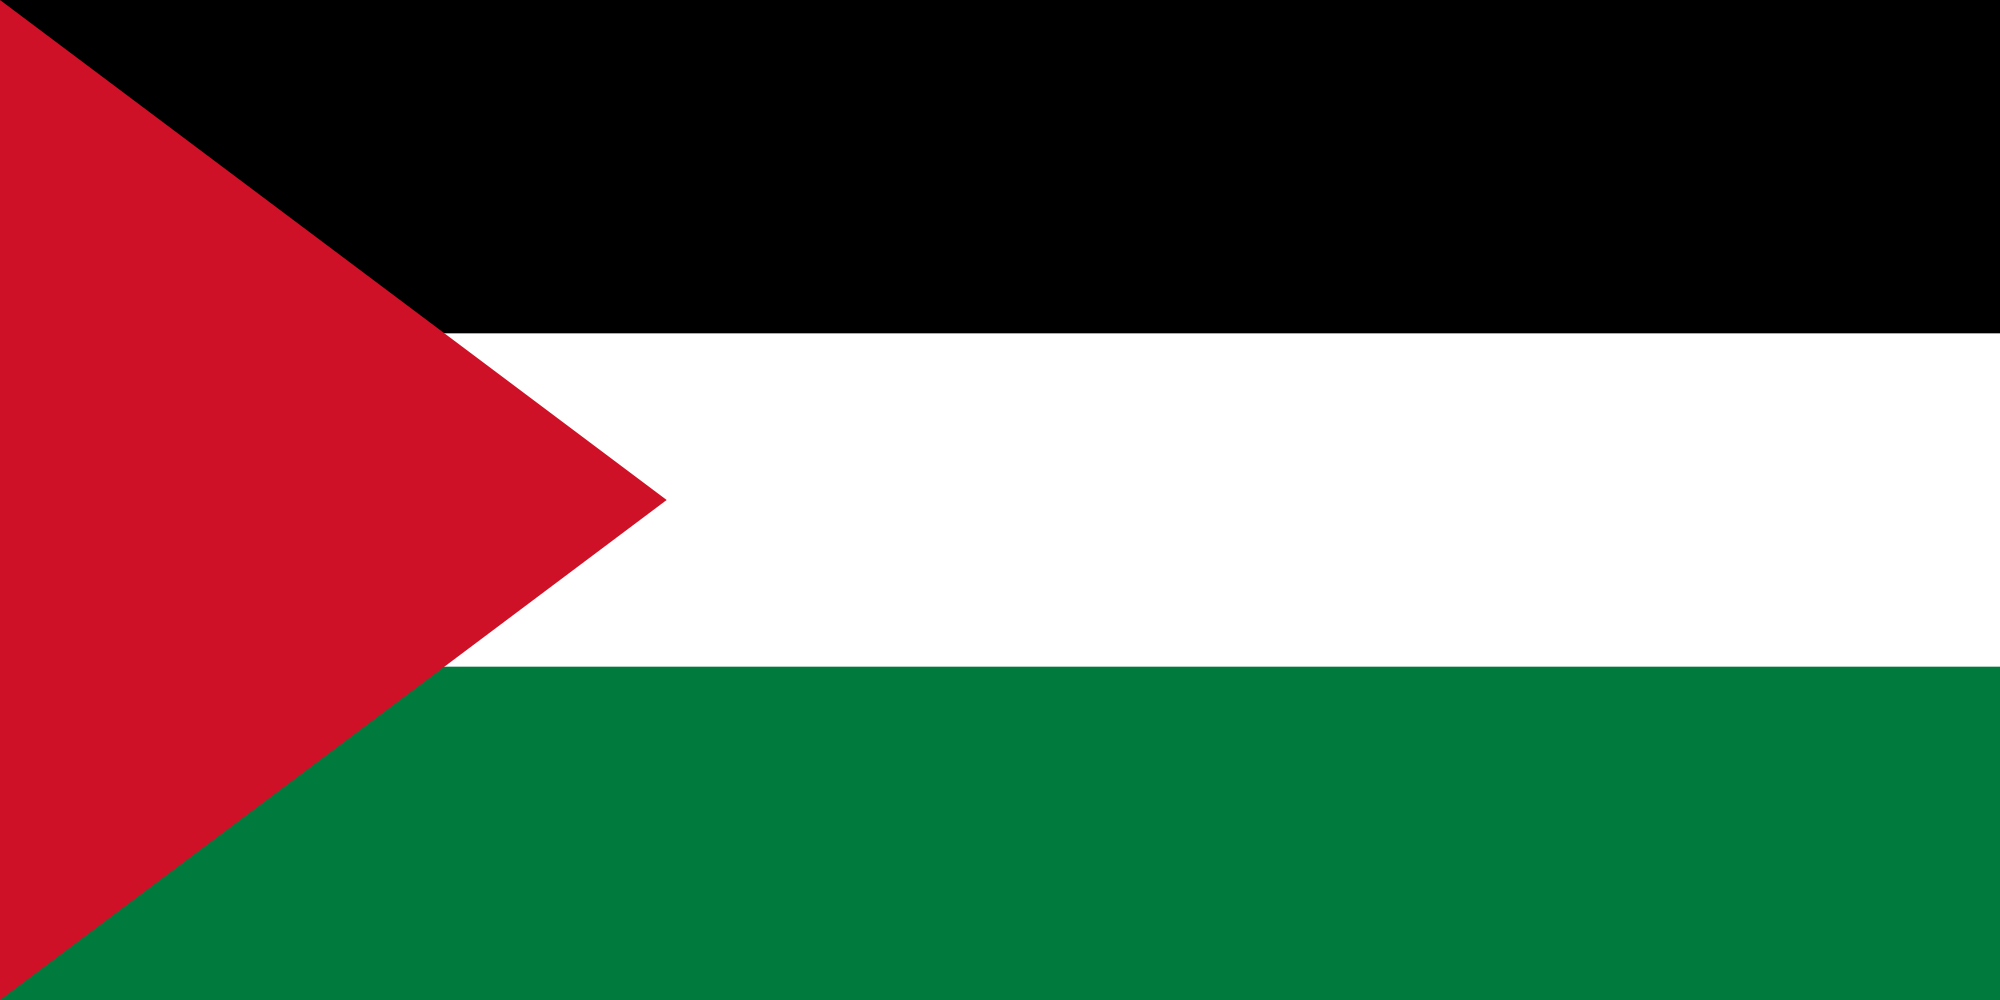
General Information
| Official Name | State of Palestine |
| Capital | Ramallah |
| Population | 4.17 million (2013) |
| Area | 6,220 km² |
| Borders | Egypt, Israel and Jordan. |
| Currency | Jordanian dinar, Egyptian pound |
| Country Code | +970 |
| Time Zone | UTC+02:00 |
| Literacy | 96.7% |
| Languages | Arabic |
| Major Cities | Ramallah, East Jerusalem, Gaza, Khan Yunis, Jabalia |
| Major Religion | Islam |
Trade Facts
In 2014, Palestine exported $920M and imported $4.54B, resulting in a negative trade balance of $3.62B. In 2014 the GDP of Palestine was $12.7B and its GDP per capita was $4.51k.
The top exports of Palestine are:
Building Stone ($165M), Other Furniture ($49.1M), Scrap Iron ($47.5M), Plastic Lids ($45.2M) and Textile Footwear ($38.5M).
The top export destinations of Palestine are:
Israel ($747M),Jordan ($87.4M), the United Arab Emirates ($13.8M), Saudi Arabia($11M) and Qatar ($8.75M).
Its top imports are:
Refined Petroleum ($958M), Petroleum Gas ($201M), Animal Food ($156M),Cars ($155M) and Cement ($140M).
The top import origins are:
Israel ($2.93B), Turkey ($252M), China ($208M), Jordan ($143M) and Egypt ($101M).
Places to See!

Al-Aqsa Mosque

Dome of the Rock